

Guide to Forex Chart Patterns for Nigerian Traders
📈 Learn key forex chart patterns and boost your trading skills with easy-to-use PDF guides. Perfect for Nigerian traders aiming to predict market moves accurately.
Edited By
Thomas Walker
Trading in Nigeria's financial markets—from the Nigerian Exchange Group (NGX) to forex and cryptocurrency—requires more than just luck. To navigate price movements confidently, understanding chart patterns is essential. These patterns are the footprints of market psychology, showing where buyers and sellers have been active, and often hinting where the price might head next.
Chart patterns are repeated shapes formed on price charts, caused by the collective behaviour of participants. Traders who can recognise these shapes can better anticipate market moves before they happen, giving an edge in decision-making.
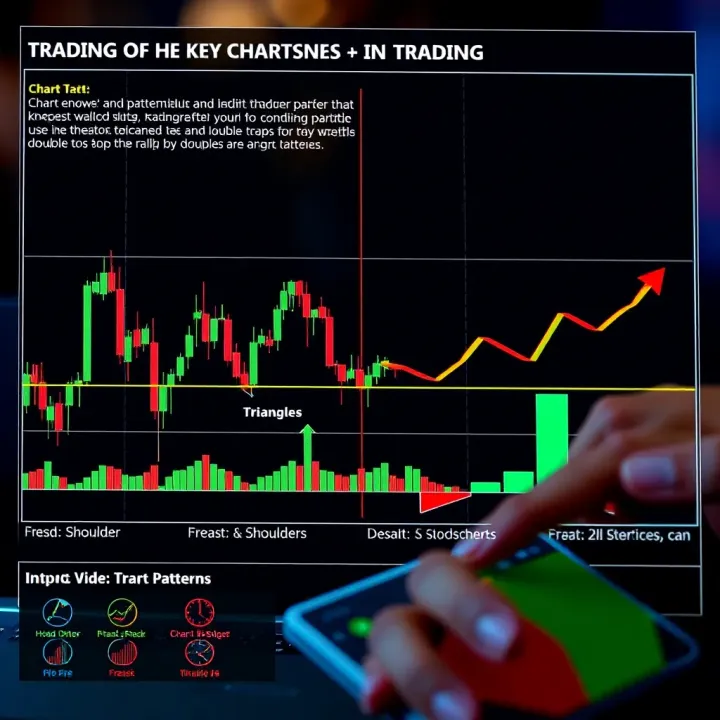
For instance, spotting a double bottom pattern on the NGX could signal a trend reversal from down to up, prompting a trader to consider buying. Similarly, a head and shoulders formation might warn a looming decline, indicating it's time to sell or tighten stop losses. These patterns apply across various markets, whether in local stocks, popular forex pairs like USD/NGN, or cryptocurrencies traded in Nigeria.
Learning these chart patterns is like having a trusted danfo driver who knows the shortcuts before traffic builds up—they can save you time and money.
This guide breaks down key chart patterns, explaining how to identify them and their significance in Nigeria's context. You'll get practical tips on applying these insights to the NGX, forex, and crypto trading. With such knowledge, you'll stop reacting to market noise and start trading with informed strategy.
Let's get clear, confident, and ready to spot opportunities where others see only chaos.
Chart patterns are visual formations created by the price movements of assets on a chart. Traders use these patterns to make sense of market behaviour and predict future price directions. In Nigeria's trading scene, from the Nigerian Exchange (NGX) to forex and cryptocurrencies, understanding chart patterns can significantly improve decision-making.
Chart patterns describe shapes and trends that price charts form over time, such as peaks, troughs, and consolidations. For example, a "double top" is where a price hits a high twice before dropping — signalling a potential reversal. These patterns reflect the tug-of-war between buyers and sellers. Recognising them helps traders spot possible market shifts without relying solely on fundamental news.
Being able to read chart patterns lets traders anticipate market moves instead of reacting blindly. For instance, if a trader spots a "head and shoulders" pattern on a blue chip stock like Dangote Cement, they might prepare to sell before prices drop. This edge reduces risks and can increase profits. Also, chart patterns often work alongside indicators like RSI or moving averages to confirm signals, offering a more robust trading strategy.
Despite their usefulness, chart patterns are not foolproof. Markets can behave unpredictably, especially when unexpected events like CBN policy changes or geopolitical issues arise. False breakouts are common; a price may appear to break a support level but quickly reverse. Overreliance on patterns without considering volume, broader market context, or news can lead to costly mistakes. Thus, patience and strong risk management must guide pattern-based trades.
Understanding chart patterns is like reading traffic signs on a busy Lagos road — they guide you, but you still need to watch out for sudden jaywalkers or danfo drivers cutting lanes.
In sum, mastering chart patterns helps Nigerian traders decode price movements, make timely trades, and manage risks effectively. However, it's crucial to combine pattern recognition with other tools and maintain discipline to navigate the market's ups and downs with confidence.
Reversal patterns are vital signals in trading because they indicate potential shifts in market direction. For Nigerian traders dealing in stocks on the Nigerian Stock Exchange (NGX), forex pairs like USD/NGN, or cryptocurrencies, recognising these patterns helps spot when a current trend might pause or switch. This knowledge can prevent holding onto losing positions too long and also identifies opportunities to enter trades with a better risk-to-reward balance.
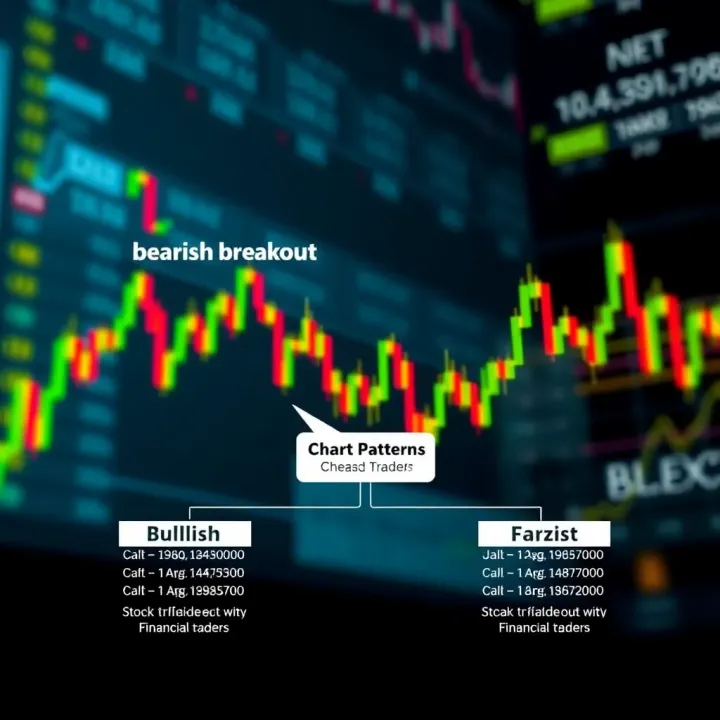
The Head and Shoulders pattern is one of the most reliable reversal signals and often marks the end of an uptrend. It forms when prices reach a peak (left shoulder), then retreat, push higher to a new peak (head), then decline again, followed by a smaller peak (right shoulder). The pattern completes once the price breaks below the neckline, which connects the lows between these peaks.
For example, if a popular NGX stock like Dangote Cement shows this pattern, it suggests that bullish momentum is weakening and a downward move might follow. Traders use this to set their sell orders or tighten stop-losses.
Double Tops and Double Bottoms are straightforward reversal patterns. A Double Top occurs when price hits a resistance level twice but fails to break through, signalling a possible downtrend. Conversely, a Double Bottom shows price touching a support level twice before reversing upwards.
Say the USD/NGN pair tests ₦460 twice within a short period without pushing higher—that’s a Double Top hinting at a fall. Nigerian forex traders may use this signal to exit long positions or prepare for short entries. It's a practical way to confirm when the market runs out of steam at key levels.
Less common but still valuable, Triple Top and Triple Bottom patterns reinforce the idea of strong resistance or support. Here, price tests the same level three times without breakthrough, often leading to a stronger reversal than double patterns.
In Nigeria’s volatile cryptocurrency markets like Bitcoin prices on Binance, spotting a Triple Top around a ₦25 million resistance level suggests sellers are firmly in control. Traders who notice this early can avoid getting trapped as price heads lower, or plan well-timed entries for a rebound from a Triple Bottom.
Recognising reversal patterns is not foolproof but combining them with volume analysis and other tools improves trade timing, helping Nigerian traders guard capital and exploit turning points better.
Continuation patterns signal that the current trend, whether upward or downward, is likely to carry on after a pause. For Nigerian traders dealing with stocks on the Nigerian Exchange (NGX), forex, or cryptocurrency markets, recognising these patterns allows smarter timing of entry and exit points. Spotting continuation shapes helps traders avoid premature decisions that could cost money, especially given Nigeria’s market volatility.
Flags and pennants appear as brief consolidations after strong price moves. A flag looks like a small rectangle slanting against the prevailing trend, while a pennant is a tiny symmetrical triangle. Both signal a short pause as the market catches its breath before pushing the trend further. For example, a forex trader monitoring the USD/NGN pair might see a strong upward surge followed by a flag pattern. Once the price breaks the flag’s upper boundary, the trader can expect the uptrend to resume, suggesting a good entry point.
Triangles show indecision with converging trendlines but lean directionally. An ascending triangle has a flat top resistance and rising bottom support, hinting at an upward breakout. Descending triangles have opposite structure, often leading to a downward slip. Symmetrical triangles squeeze prices between two converging trendlines, predicting a breakout in either direction. In Nigerian stock markets, tech shares might form a symmetrical triangle during sideways trading, signalling traders to prepare for a significant move once the price breaks out.
Rectangles form when prices move sideways between horizontal support and resistance. Channels are like rectangles tilted upward or downward, showing steady trending moves. For Nigerian cryptocurrency traders, spotting a rectangle can warn that the market is consolidating before making a fresh move. Channels help confirm sustained trends; for instance, a rising channel on a popular NGX stock suggests buying on dips near the lower channel line while watching for possible breakouts or breakdowns.
Recognising these continuation patterns equips you to trade with the trend instead of fighting it — an approach that reduces risks and improves winning chances in Nigeria’s sometimes unpredictable markets.
In practice, combining these patterns with volume trends and indicators like RSI or MACD strengthens signals. That way, you don’t rely on pattern shape alone but confirm momentum behind the moves, avoiding traps or false breakouts that can eat into your capital.
A chart patterns cheat sheet is only useful when traders know how to apply it in real market situations. In Nigeria’s financial markets, understanding how to combine pattern recognition with decision-making steps can improve your trades and reduce losses. Operating solely on patterns without context leaves you exposed to false signals and market noise.
Chart patterns don’t operate in isolation. For stronger trading signals, you should combine them with other technical tools such as volume analysis, moving averages, and oscillators like RSI (Relative Strength Index). For instance, a head and shoulders pattern confirmed by higher volume on the breakout provides more reliable evidence that a trend reversal is underway. Similarly, the Moving Average Convergence Divergence (MACD) indicator can strengthen your confidence before placing a trade on a pennant or triangle breakout. In Nigerian markets where volatility can spike due to macroeconomic news or geopolitical events, layering indicators reduces chances of costly errors.
Knowing where to enter and exit trades, and how to limit losses, is key for practical chart pattern use. After confirming a pattern like a triangle or double bottom, you should place your entry just above the breakout point to avoid getting trapped in fake moves. For exit points, measure the height of the pattern and project it from the breakout level — this gives a target price with logical profit-taking zones. Crucially, set your stop-loss below recent lows (in uptrends) or above highs (in downtrends) defined by the pattern’s structure. For example, if trading the NGX stock Zenith Bank and you spot a bullish flag, place your stop-loss just below the flag’s lower boundary to minimise loss if the setup fails. By doing this, you protect your capital while following a disciplined trading plan.
In the Nigerian Stock Exchange (NGX), patterns like double tops or head and shoulders regularly appear with blue-chip stocks such as Dangote Cement or Access Bank. For example, a double bottom on Dangote Cement shares can signal strong buying pressure after a price correction. In the forex market, the NGN/USD pair often shows ascending triangles during demand rallies; recognising this helps traders capitalise on breakouts amid naira volatility.
Crypto trading popular among Nigerian youths also benefits from chart patterns. Bitcoin price charts frequently form pennants before surges or pullbacks. Spotting these patterns early on platforms like Binance or Binance P2P can offer entry points to ride volatile price moves.
Using the cheat sheet alongside Nigerian market context, volume signals, and clear entry-exit rules sharpens your trading edge. Remember to always test your ideas with small trades before committing larger funds, especially during thorny markets or ember months when price swings increase.
This practical approach to chart pattern trading turns abstract shapes into workable strategies for Nigerian traders.
Understanding chart patterns is key for Nigerian traders, but making mistakes while reading them can cost badly. This section highlights practical tips to help you spot errors before they become expensive – a must for anyone active on the NGX, forex markets, or crypto trading.
A false breakout happens when the price moves beyond a support or resistance level temporarily, only to quickly reverse. Traders often jump in thinking the trend will continue, but the market pulls back instead. For example, a trader following the NGX might see a stock breaking above a recent high and buy, only for the stock to fall soon after due to lack of follow-through volume. Beware of poor volume behind breakouts and confirm with other indicators like RSI or MACD. This avoids chasing moves that are just traps, especially in volatile Nigerian forex pairs or cryptocurrencies.
Chart patterns don’t exist in isolation. Relying solely on them without considering broader market context leads to poor decisions. For instance, a double top might suggest a reversal but if Nigeria’s economic reports or CBN policies hint at stronger market fundamentals, the pattern might fail. Always check news, sector trends, and macro events alongside your analysis. Using patterns as one tool among many helps reduce risk and builds a clearer view of price action rather than guessing based on shapes alone.
Trading is as much mental as technical. Sticking to your plan despite a tempting “sure thing” pattern is critical. Emotional reactions can push you to enter trades too early or hold losing positions too long. Nigerian traders often face pressure from neighbours or social media hype, especially during ember months when markets react to festive spending or harvest seasons. Set clear entry, exit, and stop-loss rules, and don't let greed or fear override them. Tracking your trades with a journal can improve discipline over time and keep emotions in check.
Spotting these common mistakes early can protect your capital and sharpen your trading edge. Practice patience, confirm signals, and always step back to view the bigger picture.
By avoiding false breakouts, factoring in context, and managing your mindset, you stand a much better chance of trading confidently and successfully across Nigerian markets.
📈 Learn key forex chart patterns and boost your trading skills with easy-to-use PDF guides. Perfect for Nigerian traders aiming to predict market moves accurately.

Learn how to start forex trading in Nigeria safely 🇳🇬. Understand currency factors, pick the right brokers, manage risks, and navigate local regulations. 💹
📈 Master candlestick patterns with this practical cheat sheet! Learn key signals to boost your trading skills and make smarter market moves in Nigeria. 💹

📱Explore top trading apps in Nigeria! Learn how to pick apps with the best security, fees, and assets to trade confidently and safely in Nigeria's market.
Based on 15 reviews