

Candlestick Patterns Guide for Nigerian Traders
Master key candlestick patterns 📈 to read market moves & sharpen your trading skills in Nigeria 🇳🇬. Understand signals & boost your strategy.
Edited By
Thomas Walker
Candlestick charts stand out as one of the most straightforward yet powerful tools for Nigerian traders analysing price movements. Unlike simple line charts, these charts display detailed information about opening, closing, high, and low prices within specific timeframes. This compact visual format helps traders quickly grasp market sentiment and potential trend shifts.
Understanding basic candlestick patterns is essential for reading price action with confidence. Patterns like the Bullish Engulfing, Hammer, and Doji often signal possible reversals or continuations in price trends. For example, a Hammer with a long lower wick and small body after a downtrend may hint that buyers are stepping in, signalling a potential price bounce.
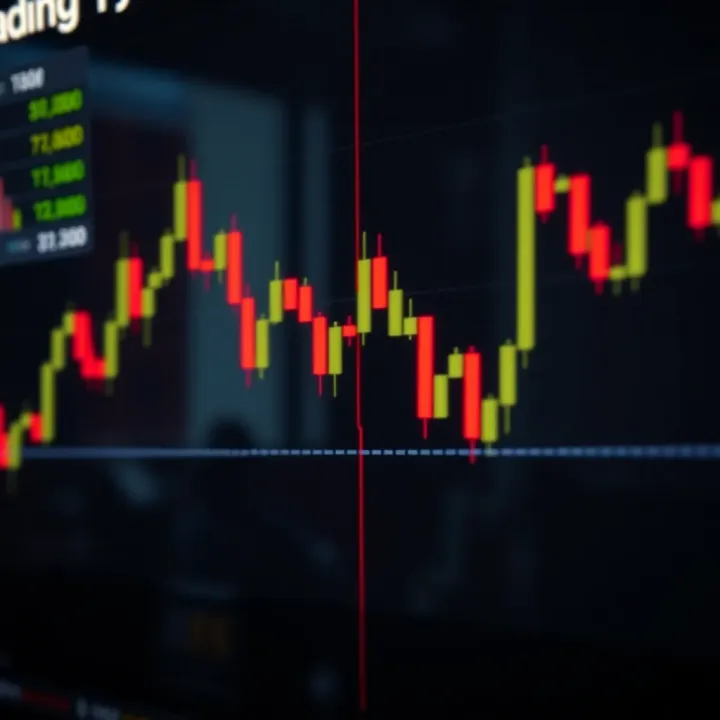
Mastering pattern recognition empowers you to make informed trading decisions rather than guesswork based on hunches.
In the Nigerian market, where forex pairs, equities, and commodities often show volatility, recognising these patterns early can improve entry and exit timing significantly. Traders on platforms like MTN’s mobile money forex apps or those using NGX-listed stocks will find these insights especially valuable for managing risk.
This cheat sheet focuses on practical, easy-to-remember patterns and how to apply them effectively in your trading strategy. You’ll learn how to spot key signals and use them alongside volume and trend indicators to confirm movement. The goal is to help you filter noise, avoid false signals, and trade with better precision.
Use this guide as your quick-reference tool during market hours or when reviewing charts at home or at the office. Combining these patterns with your existing knowledge and local market context will bring a solid edge to your trading approach. The next sections will break down each pattern, explaining what it looks like, what it suggests, and how to use it for smarter, timely decisions in Nigeria’s financial markets.
Mastering candlestick charts is fundamental for any trader aiming to interpret price movements clearly. These charts provide a snapshot of market activity within a specific period, helping traders decide when to enter or exit a position. In practical terms, candlesticks condense complex price data into a visual format that's easier to grasp than raw numbers, especially when analysing shares listed on the Nigerian Stock Exchange or watching the volatile naira-forex rates.
Each candlestick captures four key pieces of information: the opening price, closing price, the highest price, and the lowest price within its timeframe. For example, if a Nigerian stock opened at ₦250, climbed to ₦270 during the day, dipped to ₦240, and finally closed at ₦260, the candle will visually represent all these points. This layout instantly shows traders the trading range and price direction.
The practical benefit is clear: instead of tracking every tick, a trader sees at a glance how the price behaved. Short candlesticks might indicate indecision or low momentum, while long candles reveal strong movement. For day traders in Lagos or investors keeping tabs on oil sector stocks, this helps quickly assess market interest.
Colour indications are just as important. Bullish candles, which occur when the closing price is higher than the opening, are typically shown in green or white. Bearish candles, where prices close lower than they opened, appear in red or black. This colour coding makes spotting trends straightforward: a consecutive series of green candles signals sustained buying pressure, while red runs indicate selling dominance.
For instance, if shares in a telecom company like MTN Nigeria show persistent green candles, it might signal growing investor confidence. On the other hand, a string of red candles during ember months might warn of selling pressure as investors lock in profits.
Candlesticks reveal buyer and seller momentum through their shape and size. Large bullish candles suggest aggressive buying, possibly due to positive news or strong earnings reports. Conversely, tall bearish candles reflect intense selling, possibly driven by negative market sentiment or external shocks like fuel price hikes affecting transportation stocks.
Understanding this momentum helps you anticipate short-term shifts. For example, when a price rallies on strong buying but suddenly forms a small-bodied candle with long wicks, it can suggest buyers are losing steam, cautioning against chasing the trend recklessly.
Market sentiment is also visible through patterns formed by candlesticks. A series of bullish candles might reflect optimism fuelled by macroeconomic policies or strong CBN interventions stabilising the naira. Likewise, mixed candles with frequent reversals indicate uncertainty, common during election cycles or global commodity price shocks affecting Nigeria’s economy.
Recognising these psychological cues through candlestick patterns equips you with a better feel of market mood, going beyond numbers to understand why prices move.
By combining candlestick insights with local context, such as fuel scarcity impacting transport stocks or government policy announcements, you gain a more grounded trading edge tailored to Nigerian markets. This forms the basis for informed and timely trading decisions.
Single-candle patterns are the simplest yet powerful tools in candlestick charting. They offer quick insights into market sentiment without waiting for multiple candles to form. Recognising these patterns can help traders make fast and effective decisions, especially in volatile Nigerian markets where timing often makes the difference between profit and loss.
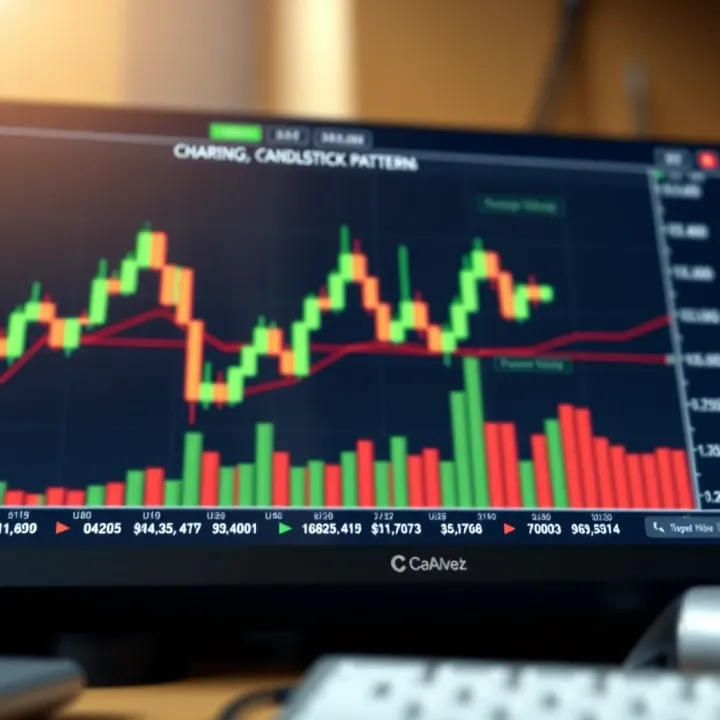
Doji candles appear when the opening and closing prices are nearly the same, signalling indecision in the market. There are several types of Doji, including the standard Doji, Dragonfly Doji, and Gravestone Doji. For example, a Dragonfly Doji, which has a long lower shadow but little to no upper shadow, indicates sellers pushed prices down during the session but buyers regained control by the close.
The significance of a Doji depends largely on preceding price action. In an uptrend, a Doji might mean hesitation, warning traders the bullish momentum is weakening. This is vital in Nigerian stock trading, where unexpected reversals can arise from market sentiments or local events. Conversely, a Doji during consolidation may mean the market is preparing for a breakout, giving you a heads-up on potential movement.
A Hammer candlestick is identified by a small body near the top of the candle with a long lower shadow, at least twice the body’s length. It shows rejection of lower prices as buyers step in aggressively, hinting at a potential bullish reversal. For instance, in NGX-listed stocks, spotting a hammer after a downtrend often signals a possible price bounce.
The main difference between a Hammer and a Hanging Man lies in their market context. Although both candles look similar, a Hanging Man forms after an uptrend and may warn of a bearish reversal. Recognising this distinction helps avoid costly mistakes—confusing the two can lead to wrong trading decisions.
The real value of these patterns is their ability to forecast trend reversals. When you spot a Hammer at the bottom of a decline or a Hanging Man near the peak of a rally, it makes sense to prepare for a possible change in direction. However, confirmation through subsequent price action or volume is essential to avoid false alarms.
A Shooting Star resembles an inverted hammer but appears after an uptrend. It has a small body near the low and a long upper shadow, indicating buyers tried to push prices higher but faced strong selling pressure. In the Nigerian forex market, this often signals that naira weakness may be ending temporarily.
Using these patterns for entry and exit points requires caution. A Shooting Star after a rise suggests selling or tightening stop-loss orders, while an Inverted Hammer following a decline may offer a buying opportunity once confirmed by the next candle. For example, when trading pairs like USD/NGN, catching these signals early can save you from sudden losses or missed gains.
Mastering single-candle patterns equips you to read market moods swiftly, a skill especially helpful when news or market events trigger sharp moves in Nigerian trading sessions.
Understanding these key single-candle patterns puts you ahead in handling market turns and managing risk efficiently. Always combine pattern recognition with volume and broader market analysis for better results.
Multi-candle patterns offer deeper insight than single candles by revealing shifts in market sentiment over a series of trading sessions. Nigerian traders benefit from recognising these patterns because they often signal stronger and more reliable market moves, helping to time entries or exits better. Using examples from the Nigerian Stock Exchange (NGX), you can see clearer momentum shifts that reflect local market nuances.
Bullish Engulfing happens when a small bearish candle is immediately followed by a larger bullish candle that completely covers the previous candle’s body. This shows buyers gaining control after a period of selling pressure, often signaling a potential upward reversal. For instance, a stock like Dangote Cement might show this pattern near a support level, suggesting a buying opportunity.
Bearish Engulfing is the opposite: a small bullish candle followed by a larger bearish candle engulfing it. This indicates sellers taking over and can warn of a downward turn. In the volatile FX market for the naira/dollar pair, seeing such a pattern after a rally could hint at weakening demand.
How to Spot Strong Reversal Signs requires observing volumes alongside such patterns. High volume confirming a bullish engulfing pattern strengthens the reversal signal. Conversely, a bearish engulfing with strong volume may suggest sellers are serious. Traders should also check if these patterns occur near known support or resistance zones to improve reliability.
Formation Structure involves three candles: the first with strong direction (down in morning star, up in evening star), a small-bodied candle signalling indecision, then a third candle confirming the reversal (up in morning star, down in evening star). This setup clearly shows a market pause before a change in direction.
Importance for Trend Changes lies in their ability to warn traders early about market sentiment shifting. For example, a morning star pattern on MTN Nigeria Plc shares after a pullback might suggest the start of an uptrend, encouraging traders to open long positions with less risk.
Strong Bullish and Bearish Trend Indicators: Three White Soldiers appear as three consecutive long bullish candles opening within the previous candle’s body, reflecting sustained buying. Conversely, Three Black Crows are three long bearish candles, signalling persistent selling. These patterns provide confidence in trend continuation or reversal, decisive for trading moves.
Typical Market Contexts where these patterns arise include post-correction phases or after consolidation. For instance, a Three White Soldiers pattern following a period of sideways movement in the NGX Index may suggest fresh upward momentum. However, traders should watch out for these appearing after extended trends, as they might signal exhaustion rather than strength.
Recognising these multi-candle patterns puts you ahead in reading the market’s mood across days instead of relying on single-session moves. For Nigerian traders, this skill adds weight to technical analysis, helping avoid premature entries or exits.
By combining these multi-candle patterns with other indicators, you strengthen your trading decisions for the often unpredictable Nigerian markets.
Candlestick patterns offer traders powerful tools to read market behaviour and anticipate price movements. When applied thoughtfully, these patterns can enhance trading success in Nigeria’s unique financial landscape. Nigerian markets often face volatility influenced by local economic factors, so understanding how candlestick signals interact with this context is key for practical trading outcomes.
The Nigerian Stock Exchange (NGX) exhibits characteristics different from more mature markets. For instance, liquidity varies considerably across stocks; blue-chip firms like Dangote Cement tend to have relatively stable volumes, while smaller companies may see erratic price swings. Thus, candlestick patterns on NGX should be interpreted with an eye on liquidity—low volume can make reversal signals less reliable.
Additionally, NGX’s price movements occasionally reflect factors beyond typical supply and demand, such as fiscal policy changes or election-related uncertainties. A hammer pattern during such periods, for example, might signal strong buyer interest but should be confirmed with volume data or fundamental news due to heightened speculative behaviour.
In the foreign exchange (FX) market, the Nigerian naira’s value is influenced heavily by central bank policies, FX supply constraints, and parallel market rates. Candlestick patterns on pairs like USD/NGN or EUR/NGN may reflect sudden shifts caused by government interventions or external shocks, making patterns alone insufficient for trading decisions. Traders should combine pattern recognition with awareness of regulatory announcements and market liquidity to avoid false signals.
Volume confirmation and support or resistance levels play a vital role in validating candlestick patterns. For example, an engulfing bullish candle at a known support level with rising volume adds conviction that a price rebound might follow. Conversely, a shooting star pattern without volume support near a resistance level might just reflect short-lived profit taking.
Integrating candlestick signals with moving averages and the Relative Strength Index (RSI) builds a stronger trading framework. A bullish hammer candle appearing as the price crosses above the 50-day moving average and with RSI rising out of oversold territory strengthens entry confidence. This multi-tool approach reduces reliance on patterns alone and improves timing and risk management in volatile Nigerian markets.
Effective trading in Nigeria’s financial markets demands combining candlestick pattern recognition with local market knowledge and other technical indicators. This blend helps navigate volatility and delivers clearer trading signals.
To sum up, candlestick patterns form part of a trader’s toolkit but shine brightest when combined with volume insights, market structure, and technical indicators suited to Nigerian equities and forex conditions.
Candlestick patterns offer valuable clues about price movements, but traders must approach them carefully. Mistakes such as misreading signals or ignoring broader market context can lead to poor decisions and losses. This section highlights practical tips to help you avoid common pitfalls when applying candlestick analysis.
Context is key when interpreting candlestick patterns. A Hammer candle at the bottom of an extended downtrend has more weight than the same pattern within a sideways market. Confirming signals from volume or other indicators like RSI helps separate genuine trend shifts from mere market noise. For example, spotting a bullish engulfing pattern with rising trading volume on the Nigerian Stock Exchange (NGX) adds credibility to a potential upward move.
Relying solely on patterns without broader confirmation exposes you to false signals. Market conditions such as news releases, macroeconomic shifts, or FX volatility can override candlestick hints. A busy ember month where investor sentiment fluctuates will often produce erratic candles not worth trading on alone. Pair pattern recognition with trend analysis and fundamental insights for better judgement.
Placing stop-loss orders strategically is vital to protect your capital. Use the recent swing low or high around the pattern as a stop point rather than arbitrary distances. For instance, after a bullish Morning Star appears on an NGX stock chart, set your stop-loss just below the star’s lowest wick. This limits downside if the reversal fails while giving room for the expected move.
Setting realistic profit targets improves your risk-reward balance. Avoid chasing outsized gains from a single pattern. If the prevailing resistance level is just 5% above your entry, expecting a 20% rise too soon might be overly optimistic. Setting targets near known support/resistance or measured moves based on candle size helps lock in reasonable profits and avoid getting caught in reversals or pullbacks.
Applying candlestick patterns without careful risk management and confirmation leads to unnecessary losses. Focus on context, use reliable stops, and set achievable goals to improve your trading success.
By combining these tips with your growing pattern knowledge, you’ll build stronger, more confident trading strategies suitable for Nigerian markets and beyond.
Master key candlestick patterns 📈 to read market moves & sharpen your trading skills in Nigeria 🇳🇬. Understand signals & boost your strategy.
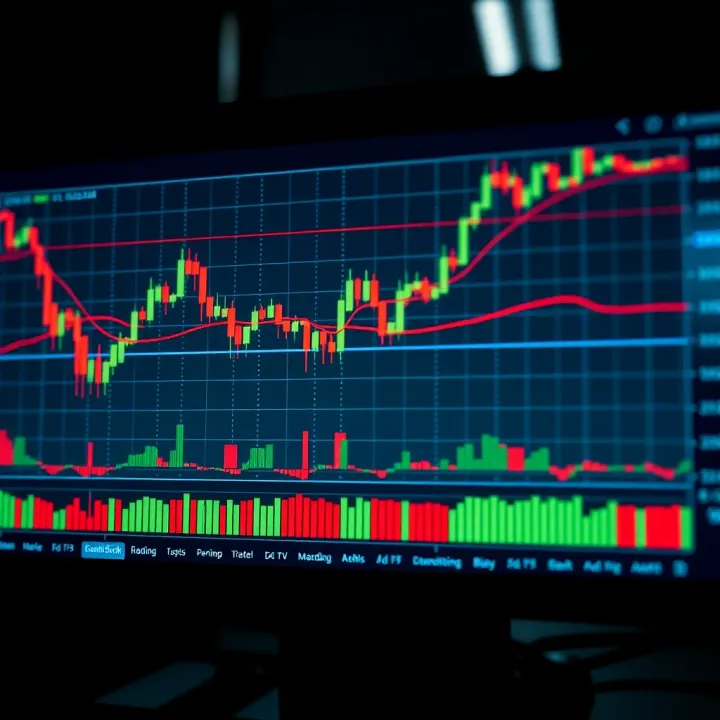
📈 Master 35 key candlestick patterns with clear explanations to boost your trading skills. Learn practical tips and download a helpful PDF guide today! 📊

📉 Learn how bearish candlestick patterns signal falling stock prices! Discover key types & tips to spot trends early and trade smarter in Nigeria. 🇳🇬

📈 Master candlestick patterns in trading with our detailed guide. Understand forms, significance & practical use, plus handy PDFs for easy reference. 📂
Based on 10 reviews