

Key Candlestick Patterns Explained with PDF Guide
📊 Learn to spot key candlestick patterns to read market trends clearly. Get a handy PDF with 35 patterns for quick study and smarter trading decisions.
Edited By
Emily Clarke
Candlestick charts have become a staple for traders and investors alike, offering a straightforward yet powerful way to interpret market movements. These charts aren't just colorful blobs on a graph; they tell a story about price action that can reveal investor sentiment, momentum, and potential turning points.
This guide focuses on 35 essential candlestick patterns that every market participant should recognize. From simple ones like the hammer or shooting star to more complex formations like the morning star or three black crows, each pattern comes with its own set of signals and implications.
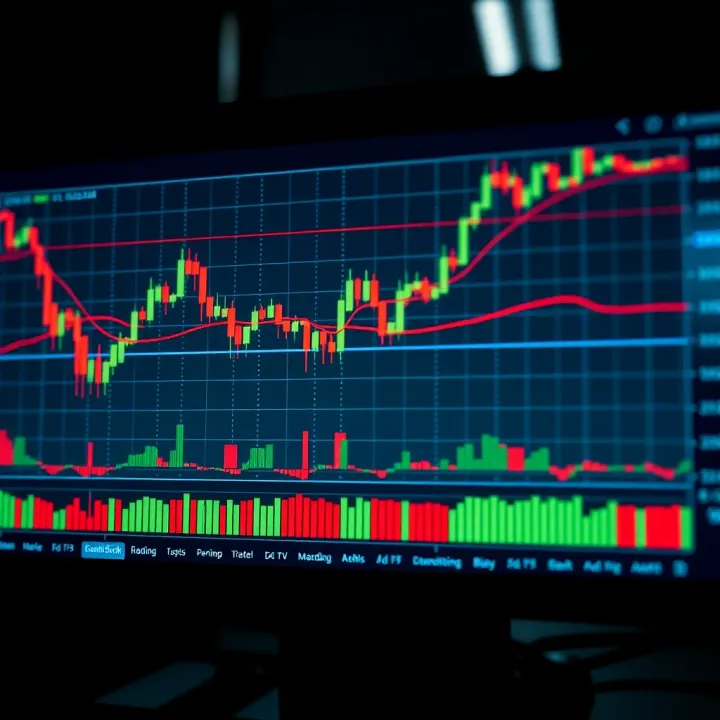
Understanding these patterns isn’t just for chart geeks. They can provide real, actionable insights that help in planning entries, exits, and risk management in trading. Whether you're day trading stocks, dabbling in forex, or analyzing commodities, these patterns serve as a common language that cuts across markets.
To keep things practical, we’ll not only explain how to spot these patterns but also discuss when to trust them and when to be cautious. Plus, a handy PDF summary is available to help you quickly review or study on the go.
Recognizing candlestick patterns can be a game changer in your trading approach—not because they predict the future perfectly, but because they reflect the behavior and psychology of market players in real-time.
This introduction lays out what you can expect from this guide: clear explanations, practical tips, and a no-nonsense approach that helps you make sense of price action with less guesswork and more confidence.
Candlestick charts are among the most popular tools traders use to interpret market movements. Understanding these charts is like having a detailed map before starting a journey; without it, you risk wandering aimlessly. This section digs into why mastering candlestick charts is essential, especially when you’re aiming to read the market’s mood and plot your trades wisely.
A candlestick carries four key pieces of info: the opening price, closing price, highest price, and lowest price during a trading session. Imagine a candlestick as a little package: the body tells where prices started and ended, while the wicks show the day's price range. For example, if a stock opens at ₦120, rises to ₦130, drops to ₦115, and closes at ₦125, the candlestick’s body spans from 120 to 125, and its wicks reach the high and low. Knowing these components helps you track price action and spot shifts in momentum.
Bullish candles indicate price gains — they occur when the closing price is higher than the opening. These candles often appear green or light-colored. Conversely, bearish candles show a price drop, where the opening price is higher than the closing, and they’re typically red or dark-colored. Seeing a string of bullish candles might hint at an uptick in demand, while several bearish candles suggest selling pressure. Recognizing these nuances assists in gauging market sentiment quickly.
To read these charts well, you look beyond a single candle — patterns over several bars reveal reliable stories. For instance, spotting a hammer candle after a downtrend could signal buyers stepping in, while spotting a doji signals hesitation in the market. Effective reading means noting candle size, shape, and placement alongside volume and trend direction. This layered approach sharpens your ability to make smarter calls on entry or exit.
Patterns aren’t just about price—they're hints about traders’ feelings and intentions. A long-bodied bullish candle tells you buyers are confident; a spinning top may mean confusion. These feelings, while intangible, directly affect price movements. So, understanding patterns helps you tap into this collective mood rather than guess blindly.
Candlestick patterns act like signals for when to jump in or get out. For example, after spotting an evening star pattern at a resistance level, one might consider exiting a long position before prices potentially reverse. Similarly, a morning star might be your green light to enter a buy trade. Timing trades based on these signals can often prevent losses and lock in profits more effectively than just relying on gut feelings.
While no method is foolproof, candlestick patterns add a layer of foresight. Suppose you recognized a piercing line pattern after a downtrend—this pattern suggests a bullish reversal, giving you a better shot at predicting price moves compared to random guessing. Pairing these patterns with other tools like volume or moving averages can increase accuracy, making your trading less of a gamble and more of a calculated move.
"Candlestick charts are like the heartbeat of the market; once you learn to read the rhythm, you can anticipate when it’s about to speed up, slow down, or take a sharp turn."
For traders in Nigeria and elsewhere, grasping how candlestick charts work and why their patterns matter sets the foundation for better, more confident trading decisions.
Understanding different types of candlestick patterns is key to making sense of market moves and sentiment. These patterns serve as visual cues that hint at potential price directions. Interpreting them correctly can turn a trader from guessing to knowing. This section breaks down how to spot and react to various candlestick formations — from a single candle's shape to multi-candle stories — helping traders decide when to hold tight or pull the trigger.
Some of the most straightforward yet telling signals come from patterns formed by just one candlestick. They often reveal indecision, potential reversals, or upcoming momentum shifts.
Doji
A Doji forms when the open and close prices are almost the same, making a cross-like shape. It signals indecision; neither bulls nor bears have the upper hand. Seeing a Doji after a sharp run-up or crash may hint that the current trend is losing steam. Think of it like a pause in a heated argument, where neither side is winning right now.
Hammer
A Hammer candle has a tiny body at the top with a long lower wick. It shows sellers pushed the price down during the session, but buyers fought back strongly to close near or above the opening price. This is often a bullish reversal sign when it appears after a downtrend. Picture a hammer banging away at the floor, signaling a potential foundation for a price turnaround.
Shooting Star
Opposite of the hammer, the Shooting Star sports a small body near the low of the session and a long upper shadow. It suggests buyers took control temporarily but sellers stepped in aggressively, pushing prices back down. When found at the peak of an uptrend, it warns of possible bearish reversal ahead — like a star shooting across the sky before vanishing.
Spinning Top
Spinning Tops have small real bodies with wicks of similar length above and below. They represent market indecision where neither buyers nor sellers dominated. Seen alone, they are mild signals, but after a strong trend, they can hint at a slowdown or consolidation phase. It’s like a tightrope walker trying to keep balance, unsure which way to lean.
Two-candle patterns add dynamics to the story. They show interaction between two periods where market sentiment shifts more noticeably.
Engulfing Pattern
An Engulfing pattern occurs when a second candle fully overlaps the body of the first one. A bullish engulfing happens when a small bearish candle is followed by a larger bullish one — hinting buyers overtaking sellers. A bearish engulfing is the reverse. These patterns suggest potential trend reversals and often draw attention from traders looking to jump on a new move.
Harami
Harami means “pregnant” in Japanese and refers to a small body candle completely contained within the previous candle’s body. It signals hesitation or a possible reversal but less forcefully than engulfing patterns. If a bullish Harami appears after a downtrend, it might mean sellers are tightening their grip, making buyers ready to step in.
Piercing Line
This bullish two-candle pattern starts with a long bearish candle, followed by a bullish candle that opens lower but closes above the midpoint of the first candle’s body. It shows buyers attempting to push prices back up strongly after a sell-off, signaling possible upward momentum.
Dark Cloud Cover
Opposite a Piercing Line, the Dark Cloud Cover starts with a strong bullish candle followed by a bearish candle opening higher but closing below the midpoint of the prior candle. It’s a bearish warning after an uptrend, hinting sellers might be gaining control.
Three-candle patterns give a more reliable picture by capturing short-term shifts in buyer and seller power over multiple periods.
Morning Star
The Morning Star is a bullish reversal pattern starting with a strong bearish candle followed by a small-bodied candle (doji or spinning top), and then a large bullish candle closing well into the first candle’s body. It’s a sign that sellers are losing grip and buyers are pushing up, often signaling the end of a downtrend.
Evening Star
The Evening Star flips the Morning Star’s logic: a strong bullish candle, a small indecision candle, then a big bearish candle. This pattern signals a potential top and the start of a downtrend, alerting traders to consider exits or shorts.
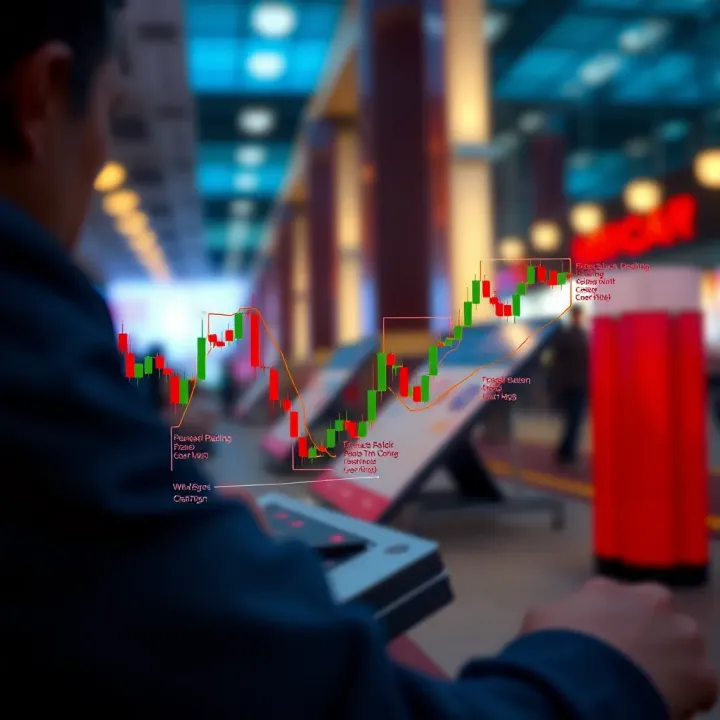
Three White Soldiers
This bullish pattern consists of three consecutive long-bodied bullish candles, each closing progressively higher. It shows persistent buying pressure and a strong uptrend.
Three Black Crows
In contrast, Three Black Crows are three descending bearish candles with little or no wicks. This pattern signals sustained selling pressure and often marks the start of a downtrend.
Recognizing these patterns isn't just about memorizing shapes but understanding the market conversations they represent. Each candle tells part of the story—together, they reveal what traders might expect next.
By grasping these candlestick types and their meaning, traders in Nigeria and beyond can sharpen their technical analysis and spot better entry and exit points. You'll see how these patterns act much like weather signals, helping you prepare for what price action might bring next.
Understanding complex multi-candle patterns can boost your trading decisions beyond simple single or double candlestick setups. These patterns often reveal stronger signals because they incorporate several bars, reflecting a more sustained market behavior. Recognizing these multi-candle formations helps traders identify potential trend reversals or continuation phases with increased confidence.
By paying closer attention to sequences like the Three Line Strike or Tasuki Gap, you get insights not just from a snapshot of the market, but a small movie that tells a richer story. This reduces the chances of whipsaws and false signals that traders sometimes face when relying solely on simpler patterns.
The Three Line Strike pattern is a powerful indicator of trend exhaustion and potential reversal. It starts with three consecutive candles that move steadily in the trend’s direction — for example, three bullish candles in an uptrend. The fourth candle then pierces deep into the previous candle’s range, often counter to the trend, signaling a possible shift.
In practice, spotting a Three Line Strike means watching for that fourth candle to close well inside the range of the first three. This shift often indicates traders are taking profits or a change in sentiment is brewing. It's a helpful early warning to tighten stops or prepare for a new phase.
The Tasuki Gap appears during trending markets and involves a gap between candles, followed by a candle moving against the trend but still within a gap. This pattern highlights a pause, or slight pullback, before continuation resumes.
Picture a rising market where a strong bullish candle gaps up from the prior day’s close, followed by another bullish candle, then a bearish candle that doesn’t close the gap entirely. This setup indicates the buyers have some hesitation but remain in control, so the trend is likely to keep moving up.
Recognizing the Tasuki Gap helps traders avoid mistaking short pauses for reversal, giving you an edge to stay in the trade longer.
Separating Lines is a simpler, yet effective, reversal pattern signaling a breakout from consolidation. It starts with a candle moving against the trend, then the next candle moves sharply in the original trend’s direction, opening at the same price as the previous close.
For example, in a downtrend, if a bearish candle closes low and the next candle opens and closes at that same level but bullish, it signals buyer strength pushing back into control.
This pattern sharpens your eye to early rebound points, making it useful for timely entries or exits.
The Rising Three Methods is a classic continuation pattern showing a strong bullish trend with a brief lodging or pause. It starts with a long bullish candle, followed by three smaller bearish or neutral candles that stay within the first candle’s price range, and then a final bullish candle that breaks the previous high.
This formation tells us the bulls took a short breather but didn’t give up control. Traders can use it as a green light to hold or add to long positions since the uptrend appears intact.
The counterpart to the above, the Falling Three Methods shows a strong downtrend pausing momentarily. It starts with a long bearish candle, then three or more smaller bullish or sideways candles within its range, followed by a final bearish candle breaking the previous low.
This indicates the bears remain firmly in charge despite a brief pullback. Spotting it can help traders confirm the downtrend continuation, giving more confidence in short-selling or exiting longs.
Recognizing these complex multi-candle patterns is about reading the market’s rhythm. They offer richer signals by capturing the tug-of-war between buyers and sellers over several periods, helping traders make smarter moves.
By adding multi-candle patterns like Three Line Strike and Tasuki Gap to your analysis toolkit, you benefit from a deeper understanding of trend behavior. It’s not just about a single candle’s story anymore — it’s seeing the episode in full.
Through practice and patience, you’ll better differentiate between real reversals and simple pauses, which is key to staying ahead in fast-moving markets.
Using a dedicated PDF reference for candlestick patterns can be a trader's secret weapon when it comes to sharpening pattern recognition on the fly. It's like having a cheat sheet that fits neatly on your device or printed out on your trading desk—ready when you need it. This section walks you through how to get the most practical use out of such a resource, turning raw pattern knowledge into real trading edge.
Easy access to pattern definitions and images
A good PDF reference lays out clear, concise definitions paired with visual examples of each candlestick pattern. This combo helps traders quickly refresh what a Hammer or an Engulfing pattern looks like without fumbling through books or digital tabs. Pictures stick in your mind far better than words alone, making it easier to spot these formations during fast market action. Say you're scanning a chart and something looks odd—one quick peek at the PDF can confirm if you’re witnessing a Morning Star or just a random price movement.
Printable guides for quick reference
Sometimes digital devices aren’t the best friends during hectic trading days—screens go dim, apps crash, or notifications distract. Here, a printable guide is a handy backup. You can stick it on a notice board, keep it in your trading binder, or just glance at it on your desk. This physical presence encourages frequent, almost subconscious, review which helps patterns become second nature over time. It’s pretty neat how just having the patterns visibly around can boost your confidence when trading live markets.
Support for self-paced learning
Not everyone can dedicate hours straight to studying charts, especially if you're juggling other responsibilities. A PDF guide supports self-paced learning by letting you study patterns at your own rhythm. Maybe you focus on single-candle patterns one day and move onto three-candle formations the next. You can bookmark pages or use highlights to prioritize tricky patterns or those you encounter most often in your usual markets. This flexibility makes it easier to build solid technical skills steadily without feeling overwhelmed.
Comparing patterns against live charts
Theory is great, but candlestick patterns come alive when you match them with real-time data. Use the PDF side-by-side with your trading platform; whenever a candlestick forms, flip the PDF open to compare. For example, if a Doji pops up after a downtrend, see if the visual matches the PDF definition and what the indicators say. This habit cements your understanding and helps you see how patterns unfold in actual market conditions.
Highlighting patterns during market hours
Everyone knows practice makes perfect, but practice during active market hours is gold. Pick specific times when markets are most volatile, like the opening or closing hours of the Nigerian Stock Exchange. Use the PDF to highlight or note down candlestick patterns you spot in those moments. Tracking occurrences in live trading hones your quick-spotting ability and teaches you which patterns hold weight versus those that don't confirm with volume or trend.
Regular review to build recognition speed
Speed is key in trading, and no one learns all 35 essential patterns overnight. Regularly revisiting the PDF lets you internalize the forms until recognizing them becomes instinctive. Schedule short daily or weekly review sessions—maybe 10 minutes with your morning coffee—where you skim through the patterns to refresh your mental catalog. Over time, you'll spend less effort thinking and more time trading smartly.
Keeping a candlestick patterns PDF handy isn't just about memorizing definitions; it's about building a toolkit you can trust when making quick decisions. Treat the PDF like a trading companion, and you'll find your pattern recognition and confidence both climb handsomely.
Integrating candlestick patterns into your trading strategy isn't just about spotting shapes on a chart; it's about blending these visual clues with other tools to make smarter decisions. Candlestick patterns by themselves can signal potential market moves, but when combined with other indicators, they offer a more reliable picture. This approach helps traders avoid false signals and better manage risk. For example, catching a bullish engulfing pattern alongside increasing volume provides stronger validation than relying on the pattern alone.
Volume acts like the voice of the market, telling you how strong a move really is. When a candlestick pattern, say a hammer or a shooting star, forms on low volume, it's often just noise. But if you spot a bullish engulfing candle on high volume, it means more traders are backing that move. This kind of confirmation helps avoid traps where the price seems to reverse briefly but then continues its original direction. So, always check if the volume backs the pattern before making a trade.
Moving averages smooth out price action and offer clues about overall trends. Pairing candlestick patterns with moving averages can sharpen entry and exit points. For example, a bullish morning star pattern appearing near the 50-day moving average can signal a stronger buying opportunity if the price bounces off that level. Similarly, if a bearish pattern forms below the 200-day moving average, it’s often a cue that the downward trend could continue. Combining these tools reduces guesswork and improves timing.
Trendlines define support and resistance areas where price often reacts. When a candlestick pattern occurs right at a trendline, it tends to have more significance. Imagine spotting a piercing line pattern just above an ascending trendline; this strengthens the chance of a bullish bounce. On the flip side, a bearish engulfing candle near a descending trendline can confirm selling pressure. Using trendlines to validate candlestick signals acts like a double-check, making your trades more confident.
Effective risk management is key to turning candlestick patterns into profitable trades. Patterns are useful, but markets don’t always behave as expected. Putting clear risk controls in place prevents small mistakes from turning into big losses.
Stop-loss orders limit potential loss if a trade goes south. After identifying a pattern, decide beforehand where to place your stop-loss. A common approach is setting it just beyond the pattern’s extreme. For instance, once a trader spots a hammer pattern hinting at reversal, placing a stop-loss a few pips below the hammer’s low protects capital if the market moves against you. This discipline helps cut losses early and keeps your account safe.
No pattern is perfect. Relying on just one formation without cross-checking other signals or market context often leads to poor trades. If every hammer or doji is treated as a buy signal without weighing volume, trend, or market news, you’re asking for trouble. Instead, use patterns as part of a broader toolkit. Mix multiple indicators and keep a checklist before entering trades, so you don’t fall into the trap of overtrading based on “cute” shapes alone.
Markets don’t stay the same — they shift from trending to sideways and back again. Candlestick patterns behave differently depending on this. For example, reversal patterns may fail in a strong trend but work better during consolidations. Successful traders notice these subtle shifts and adjust their strategy accordingly. That might mean waiting longer for confirmation or skipping trades if the conditions aren’t right. Being flexible and alert to market mood saves you from getting caught on the wrong side.
The takeaway: Candlestick patterns shine brightest when they’re part of a thoughtful strategy combining other indicators and strict risk controls. They’re not standalone magic but powerful clues to what the market might do next.
By weaving candlestick patterns into your plan with volume, moving averages, and trendlines, while managing risk through stops and avoiding over-trading, you set yourself up for smarter, more controlled trading outcomes.
When working with candlestick patterns, traders often stumble into common pitfalls that can trap even the most earnest investors. Recognizing these mistakes is half the battle toward sharpening your technical analysis. The big catch here? Candlestick patterns don’t operate in a vacuum. They must be understood in context and combined with solid risk management to really pay off.
Ignoring volume and market trends is one of the classic blunders. Imagine spotting a bullish engulfing pattern and jumping in heads-first, only to find out the market’s overall trend is bearish and the volume is drying up. Volume acts like the heartbeat of a pattern — without a decent pulse behind a signal, it’s often too weak to trust. For example, a hammer candle at the bottom of a downtrend backed by rising volume can hint at a genuine reversal. But if volume is low, it might be just a dead cat bounce. Always check if the volume supports what’s going on price-wise.
Failing to confirm signals with other tools is another trap. Candlestick patterns give clues, but layering on other indicators like moving averages, Relative Strength Index (RSI), or trendlines can help separate the wheat from the chaff. Think of it as double-checking your work. A morning star pattern might look neat on its own, but confirming it with a break above the 50-day moving average or bullish RSI momentum adds muscle to your conviction.
Remember: Candlestick patterns without context are like road signs without a map. They’re helpful, but don’t rely on them blindly.
Chasing patterns that lack strong follow-through is a money pit. Not every pattern results in the move you expect. Sometimes, a bullish engulfing candle may appear, but the next sessions show sideways price action or even a reversal back down. Jumping in repeatedly on these weak signals can drain your capital fast. It's better to wait for confirmation, such as a closing price above a significant resistance or other indicators agreeing, rather than jumping at every pattern.
Neglecting overall risk exposure is a quick path to trouble. Some traders spot a promising candlestick setup and go all-in without thinking about their total portfolio’s risk. This often means ignoring appropriate stop-loss placement or position sizing, turning a minor mistake into a big loss. Proper risk management isn’t just a suggestion — it’s essential. Setting your stop-loss just below a support level or recent low tied to the candlestick pattern can limit damage. And never risk more than a small percentage of your trading capital on a single trade.
By keeping these common errors in check, you’re not just spotting candlestick patterns—you’re reading the whole story the market’s trying to tell and trading smart. The patterns are signals, yes, but what you do with those signals is what ultimately counts.
Diving into candlestick patterns is just the start—building solid grasp requires tapping into the right resources. Whether you’re a trader, analyst, or investor, having trusted books, websites, and hands-on practice tools can make a world of difference. This section lays out practical ways to deepen your knowledge and sharpen your skills beyond just theory.
Books remain a classic way to get detailed, structured insight into candlestick analysis. For instance, Steve Nison’s Japanese Candlestick Charting Techniques is often considered the gold standard. It’s packed with real trading examples that reveal how patterns behave in different markets. Another solid pick is Thomas Bulkowski’s Encyclopedia of Candlestick Charts, which offers an extensive catalog of patterns with statistical success rates.
These books go beyond just showing charts; they explain the psychology behind the patterns, which is a game-changer for trading decisions. Reading them can help you spot patterns more confidently and understand when they’re more likely to work—or fail.
Websites like Investopedia and BabyPips offer free and easy-to-understand tutorials on candlestick patterns. For deeper training, courses from platforms like Coursera or Udemy provide structured lessons with video explanations, quizzes, and even live chart demonstrations.
When selecting courses, look for those that balance theory and practice, including real market data. Some trading forums also serve as valuable communities where traders discuss how they interpret candlestick signals day-to-day, offering insight you won’t find in textbooks.
Demo trading accounts mimic real market conditions without risking actual money. These platforms are excellent for applying what you learn about candlestick patterns. You can enter and exit trades, test strategies, and observe how patterns develop in real time.
For example, if you spot a "Morning Star" pattern, you can place a mock buy order in the demo account to see how the price moves. This hands-on approach helps connect textbook knowledge with real market behavior, revealing nuances that aren’t obvious on paper.
Trading with real money comes with pressure, and even the sharpest traders make mistakes under stress. Demo accounts let you experiment and build confidence at your own pace. Repeating trades with different patterns helps develop quick pattern recognition and decision-making skills.
Importantly, this risk-free environment encourages learning from mistakes without financial pain. When you finally go live, you’ll have a better feel for timing, risk management, and how candlestick patterns play out in the real world.
Consistent use of these resources and demo practice can turn pattern recognition from a guessing game into a dependable skill, critical for better trading results.
Bringing in varied educational tools and practice setups enriches your understanding, making your candlestick analysis sharper and your trades smarter. Don’t rush—take time to explore these resources while steadily applying what you learn.
📊 Learn to spot key candlestick patterns to read market trends clearly. Get a handy PDF with 35 patterns for quick study and smarter trading decisions.

📈 Master candlestick patterns in trading with our detailed guide. Understand forms, significance & practical use, plus handy PDFs for easy reference. 📂

Master key candlestick patterns 📈 to read market moves & sharpen your trading skills in Nigeria 🇳🇬. Understand signals & boost your strategy.
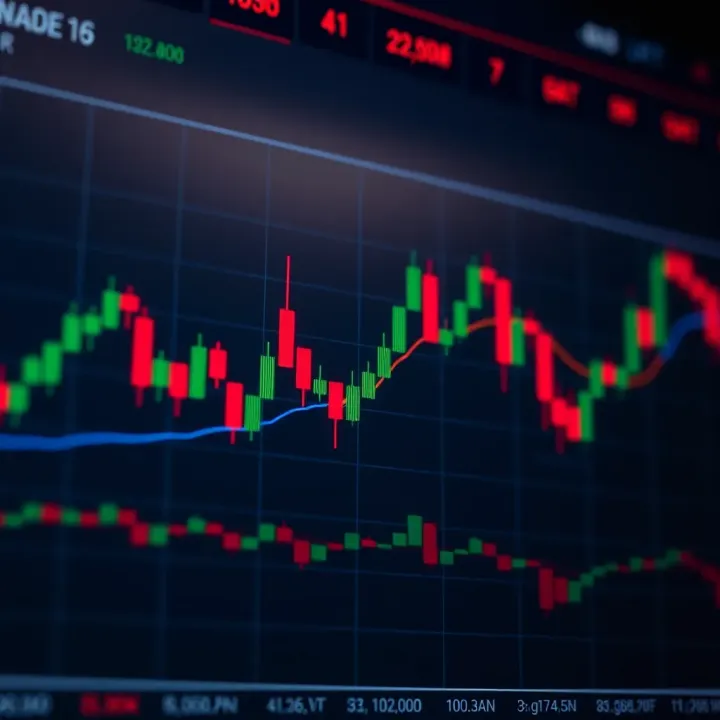
📉 Learn to spot bearish reversal candlestick patterns that signal a market shift from uptrend to downtrend. Get practical trading tips for better timing.
Based on 5 reviews