

Candlestick Patterns Guide for Nigerian Traders
Master key candlestick patterns 📈 to read market moves & sharpen your trading skills in Nigeria 🇳🇬. Understand signals & boost your strategy.
Edited By
Isabella Hayes
Bullish candlestick patterns provide clear clues that prices may be on the rise. Recognising these patterns can help traders make smarter choices about when to buy or hold assets. This knowledge is especially critical in Nigeria's markets, where volatility and local challenges like exchange rate swings or power outages affect trading decisions.
Candlesticks chart price action visually, showing the opening, closing, high, and low prices within a set period. When the closing price is higher than the opening, the candle typically appears bullish, often in green or white. These patterns are more than just colourful shapes; they reveal market sentiment shifts that precede price increases.
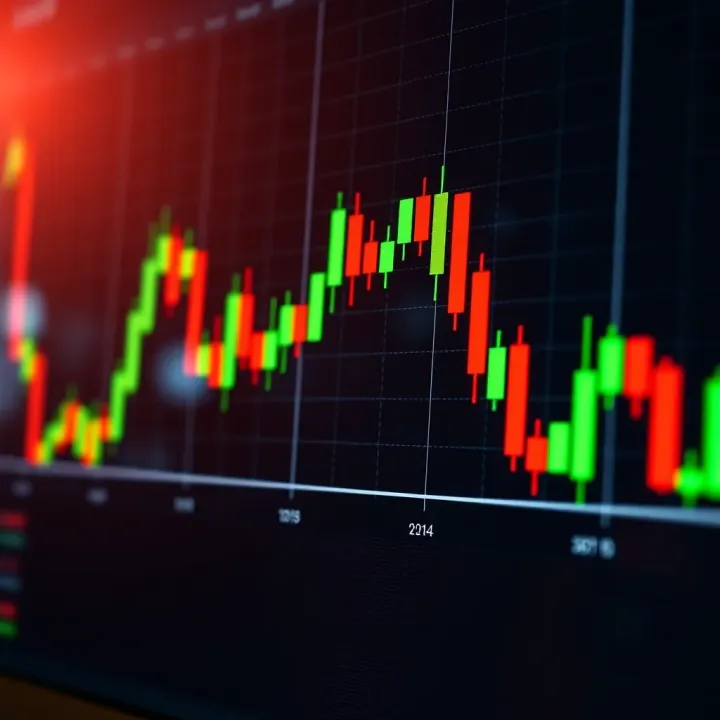
For example, the Hammer pattern signals a possible market bottom after a downtrend. It features a small body with a long lower wick, indicating that sellers pushed prices down but buyers regained control before the period closed. Spotting a Hammer can mean it's time to look for buying opportunities before the price bounces back.
Another pattern, the Bullish Engulfing, occurs when a small bearish candle is followed by a larger bullish candle that completely covers it. This signals rising buying pressure, often at the end of a decline, giving a strong hint that the market might reverse upwards.
Understanding these patterns involves more than memorising shapes; context matters. The trend before the pattern, volume changes, and news that affect specific sectors in Nigeria like oil or telecoms influence the strength of a signal. For instance, a Bullish Engulfing after days of falling oil prices might suggest traders are ready for a rebound.
Pro tip: Always combine candlestick analysis with other indicators and local market awareness. Relying only on patterns is risky, given Nigeria’s market quirks such as naira fluctuation and irregular market liquidity.
By integrating bullish candlestick signals with reliable data and a grasp of local factors, traders can sharpen their entry points and avoid pitfalls. Always watch the bigger picture and confirm signals before committing your capital.
Next, we'll explore key bullish patterns in detail, highlighting how to identify them and apply their insights effectively.
Bullish candlestick patterns are a fundamental tool for traders and investors looking to spot potential market upswings. In Nigerian markets like the Nigerian Exchange Group (NGX), recognising these patterns can give you an edge, especially when naira volatility and local economic factors influence price movements. This section introduces the basics of candlestick charts and why bullish patterns are key signals for possible price increases.
Candlestick charts display price action visually, showing the open, close, high, and low prices for a particular period. Each ‘candlestick’ represents one interval—whether a day, an hour, or even minutes. The shape, colour, and position of the candlestick reveal crowd behaviour, helping traders infer whether buyers or sellers dominated that period.
For example, a long green candle on an NGX stock chart means buyers pushed prices up strongly within that session. This simple visual cue helps traders decide when to enter or exit positions, making charts both informative and practical for day-to-day decision making.
The key difference between bullish and bearish candlestick patterns lies in the expected price direction they imply. Bullish patterns suggest upward momentum and potential price gains, whereas bearish patterns warn of declining prices. While a bullish engulfing pattern signals buyers overpowering sellers, a bearish engulfing indicates the opposite.
Understanding these distinctions reduces guesswork and guides traders to align their strategies with the prevailing market sentiment. For instance, a trader in Lagos spotting a ‘hammer’ pattern on a local banking stock might anticipate a price rebound and act accordingly.
Bullish candlestick patterns indicate shifts in market sentiment from pessimism to optimism. Market participants collectively express confidence by pushing prices up, reversing prior sell-offs. Spotting these turning points early lets traders take advantage before widespread buying drives prices higher.
In Nigerian markets, where economic indicators can shift swiftly, such sentiment signals serve as quick checks on broader conditions. For example, after CBN policy announcements or inflation reports, bullish patterns often emerge in affected sectors, offering traders timely clues.
More importantly, these patterns do not just reflect sentiment but help predict upward price movements. When combined with volume data or other indicators like the Relative Strength Index (RSI), traders can validate signals and improve accuracy. This approach avoids chasing false positives common in volatile conditions, such as during ember months when market activity fluctuates significantly.
Recognising bullish candlestick patterns equips you with a practical method to anticipate market moves, helping optimise entry points and manage risks effectively.
By mastering these basics, Nigerian traders improve their chances to benefit from upward trends on the NGX or commodities markets, harnessing visual tools that simplify complex price dynamics into clear signals.
Recognising common bullish candlestick patterns is essential for traders who want to anticipate upward price movements. These patterns provide practical signals about market sentiment shifts and help you decide when to enter or exit positions. Mastery of these patterns reduces guesswork and improves timing, which is especially useful when trading on volatile markets like the Nigerian Exchange Group (NGX).

Hammer and Inverted Hammer: The hammer is a single candle with a small body and a long lower wick, appearing after a price decline. This shape indicates that sellers pushed the price down during the session, but buyers regained control before the close. It signals potential reversal to upside momentum. For example, if an NGX stock like MTN Nigeria shows a hammer after several days of decline, that might suggest buyers are stepping in.
The inverted hammer has a small body with a long upper wick and appears after a downtrend as well. It suggests buyers tried to push the price upwards but met resistance. Still, it warns of possible bullish reversal if followed by confirmation candles.
Marubozu Candle: This pattern has a full-bodied candle without shadows/wicks on either end, signalling strong buying pressure throughout the session. A bullish Marubozu appears when the opening price is at the low and the closing price at the high. For instance, in a bullish run for a popular NGX blue chip like Dangote Cement, seeing a Marubozu candle means buyers dominated, and the upwards trend could continue without much resistance.
Bullish Engulfing Pattern: This pattern appears when a small bearish candle is entirely engulfed by a following larger bullish candle. It represents a shift from sellers to buyers, capturing growing optimism. On NGX charts, this pattern often precedes price rallies, making it a reliable entry signal if confirmed by volume.
Morning Star: Consisting of three candles, the Morning Star indicates a significant reversal. The first is a long bearish candle, followed by a small-bodied candle (star) signalling indecision, and lastly, a strong bullish candle closes above the midpoint of the first candle. This pattern suggests sellers are losing control and buyers gaining strength. If an MTN share price displays this amid a downtrend, it points to a fresh bullish start.
Three White Soldiers: This pattern features three consecutive bullish candles, each closing higher than the previous one, with little to no shadows. It illustrates persistent buying pressure and confirms a strong bullish trend. Nigerian traders watching an upward surge in access bank stocks might spot this pattern as a signal to hold their positions or add more.
Understanding and spotting these patterns on charts give you an edge in timing trades and managing risks effectively. Combining them with volume and other technical tools enhances their accuracy.
Remember that no single pattern guarantees success; confirmation and context within wider market trends matter greatly.
Understanding how to spot bullish candlestick patterns on Nigerian market charts is fundamental for traders aiming to time their entries well. Unlike general market analysis, applying candlestick recognition specifically to the Nigerian Stock Exchange (NGX) allows investors to read local market sentiment more accurately and adapt to unique market behaviours.
The NGX provides essential historical and real-time data that traders use to identify bullish patterns like the hammer, bullish engulfing, or morning star formations. For example, when analysing a popular stock such as Dangote Cement, recognising a bullish engulfing pattern alongside volume spikes could suggest a strong buying interest, signalling a potential price rise. This direct use of data helps traders make decisions based on observable price action rather than rumours or assumptions.
However, challenges like high volatility and inconsistent liquidity on NGX stocks can complicate pattern recognition. Some stocks, especially in less active sectors, might experience low daily volumes, resulting in price movements that don’t always follow standard candlestick signals. For instance, a sudden surge in price causing a bullish pattern might be triggered by thin trading, which increases the chance of false signals. Traders must therefore combine their candlestick analysis with awareness of the stock’s liquidity and recent trading trends.
Several tools tailor charting software for Nigerian traders to spot bullish patterns effectively. Platforms like ProRealTime, TradingView, and even local brokerage interfaces such as Meristem's or Chaka’s apps provide interactive candlestick charts with pattern recognition features. These tools allow users to zoom into NGX stocks and overlay indicators, simplifying the spotting of bullish patterns directly on their phones or laptops.
Beyond charting, the integration of candlestick pattern recognition into local platforms matters. Brokers like GTI Securities and Bamboo have incorporated live charting and alerts into their portals, enabling users to execute trades on the spot when bullish patterns emerge. This seamless integration helps Nigerian traders respond swiftly to market moves, a key advantage in a market with rapid price swings during ember months or political cycles.
Mastering bullish candlestick patterns with NGX-specific tools and awareness of market quirks promotes smarter trading choices and cuts down on costly guesswork.
By blending solid pattern recognition with an understanding of NGX’s quirks and the right tools, Nigerian traders can sharpen their market strategies and improve timing for better returns.
Incorporating bullish candlestick patterns into your trading strategy can sharpen your entry and exit decisions significantly. These patterns often signal potential upward price moves, but combining them with other analysis tools improves accuracy and reduces risks. Nigerian markets, with their particular volatility and liquidity challenges, require traders to be extra cautious and strategic when relying on these signals.
Volume confirmation is essential to validate the strength of a bullish candlestick pattern. For example, when a bullish engulfing pattern appears with increased trading volume on the Nigerian Stock Exchange (NGX), this suggests more buyers are entering the market, supporting the move. If volume is low, the pattern might not indicate a genuine trend reversal but simply a momentary price blip. Therefore, checking volume helps separate serious trend shifts from false alarms, especially in stocks with moderate liquidity.
Alongside volume, traders often use technical indicators like the Relative Strength Index (RSI) and moving averages to complement candlestick patterns. RSI measures overbought or oversold conditions, so spotting a bullish pattern while RSI is below 30 (oversold zone) can highlight a good buying opportunity. Similarly, moving averages—like the 50-day or 200-day—help confirm trend direction: a bullish candlestick pattern forming above these averages strengthens the signal for an uptrend. For instance, a Morning Star pattern emerging near the 50-day moving average on a popular NGX stock like Dangote Cement may reinforce confidence in the trade.
Setting stop-loss orders is a practical way to limit potential losses when trading on candlestick patterns. Since even strong-looking bullish patterns can fail, defining your maximum acceptable loss upfront keeps you from facing big setbacks. For example, after entering a trade based on a Hammer candlestick in Nigerian banking stocks like GTBank, you might place a stop-loss just below the candle’s low. This approach protects your capital if the market doesn't move as expected.
Position sizing plays a vital role in managing risk too. Allocating the right portion of your trading capital depending on your risk tolerance ensures you don't expose too much to one trade. For instance, a trader might decide to risk only 2% of their total capital on any single NGX stock trade based on a bullish pattern. Smaller position sizes also help absorb the impact of possible false signals and keep liquidity intact, which is important given the sometimes volatile Nigerian market environment.
Combining candlestick analysis with volume, technical indicators, and sound risk management offers a practical edge for Nigerian traders. Always remember: patterns guide, but risk control decides the final outcome.
Bullish candlestick patterns serve as useful tools for traders, but depending solely on them can lead to costly errors. Understanding the limitations and pitfalls prevents overconfidence and mitigates risks, especially in Nigeria's dynamic market environment. Traders who learn when and why these patterns may fail tend to make better decisions and protect their capital.
False signals occur when a bullish pattern appears but the anticipated price rise does not materialise. This can happen due to temporary market noise or manipulated price movements. For example, a bullish engulfing pattern might trigger a buy, but if broader selling pressure overwhelms, the price could still fall. Nigerian traders risk losses if they act on patterns without confirming with other indicators like volume or trend analysis.
Being aware of false signals means relying on candlestick patterns as part of a bigger toolkit rather than a standalone method. Verification with tools such as Moving Averages or the Relative Strength Index (RSI) reduces the chance of falling for misleading signals, thus improving trade quality.
Candlestick patterns reflect short-term price action but ignore larger economic conditions impacting the market. Events like fuel subsidy removal, foreign exchange fluctuations, or political instability can override what technical patterns suggest. For instance, even a strong bullish setup on an NGX stock might fail to breakout if the naira weakens sharply or power supply issues hamper company operations.
Practical trading requires integrating macroeconomic awareness alongside technical analysis. Traders should track local policy changes, key economic indicators, and global market trends to avoid being blindsided by external factors that nullify bullish patterns.
Periods of sharp, unpredictable price swings often distort candlestick patterns. High volatility, which Nigeria's market occasionally exhibits during election times or global shocks, can result in erratic candles that mislead traders. A classic morning star might form during volatile sessions, yet price could swing wildly afterwards, spoiling expected gains.
In such markets, relying on bullish patterns can increase risk rather than reduce it. Traders should be cautious or consider alternative approaches like waiting for volatility to subside before committing to trades based on patterns.
Bullish candlestick patterns perform poorly in sideways or range-bound conditions. When prices trade within a narrow band, signals like the three white soldiers may occur without leading to lasting uptrends. The Nigerian stock market often moves sideways amid low liquidity or uncertain business climates.
In these situations, traders must recognise that bullish patterns lose their edge. It’s better to combine them with support and resistance levels, or use other strategies like range trading rather than expecting sustained breakouts.
Successful trading with candlestick patterns isn’t about blindly trusting them but about knowing their limits and working them into a broader, well-informed strategy.
Properly understanding these limitations helps Nigerian traders avoid common mistakes, conserve capital, and pursue smarter, more confident investment decisions.
Master key candlestick patterns 📈 to read market moves & sharpen your trading skills in Nigeria 🇳🇬. Understand signals & boost your strategy.
📈 Master 35 key candlestick patterns with clear explanations to boost your trading skills. Learn practical tips and download a helpful PDF guide today! 📊

📉 Learn how bearish candlestick patterns signal falling stock prices! Discover key types & tips to spot trends early and trade smarter in Nigeria. 🇳🇬

📈 Master candlestick patterns in trading with our detailed guide. Understand forms, significance & practical use, plus handy PDFs for easy reference. 📂
Based on 8 reviews