

Understanding Crypto Chart Patterns for Nigerian Traders
🔍 Learn to spot key crypto chart patterns for smarter trading in Nigeria. Discover how to predict price moves & avoid losses, boosting your ₦ trading game today!
Edited By
Emma Sinclair
Understanding chart patterns is a key skill for Nigerian traders who want to boost their market timing and decision-making. Whether you trade shares on the Nigerian Stock Exchange (NGX) or participate in forex trading with platforms like Oanda or local fintech apps, recognising these patterns can make a big difference.
Chart patterns are formations on price charts that suggest possible future price movements. They fall into two main categories:

Reversal patterns signal that the current trend may change direction.
Continuation patterns suggest that the existing trend will carry on.
For example, imagine you spot a "Head and Shoulders" pattern forming on the NGX chart of a popular stock like MTN Nigeria. This pattern often indicates the price might reverse from an uptrend to a downtrend. Traders can use this signal to time their exit and protect profits.
On the other hand, a "Symmetrical Triangle" pattern might appear on the forex chart for USD/NGN. This usually means the market is pausing before continuing in the same direction, helping traders to prepare for potential breakouts.
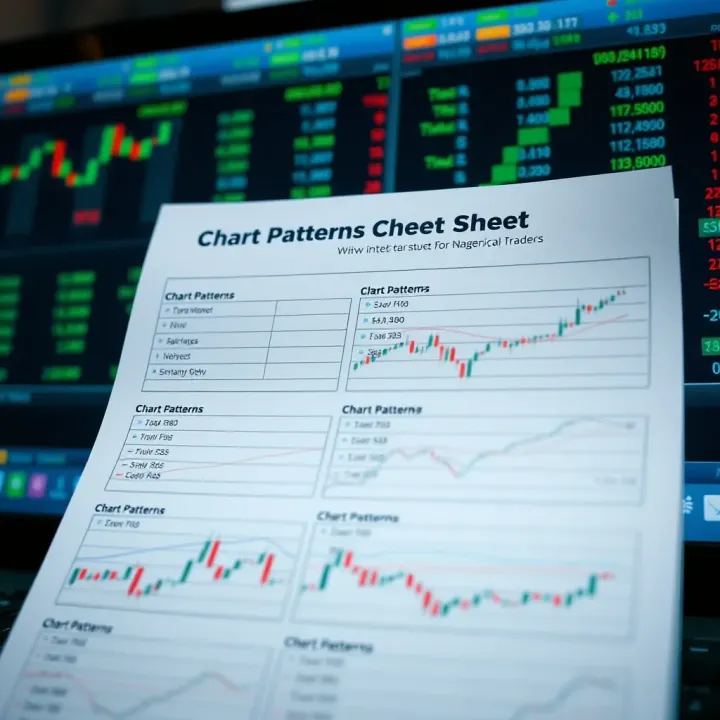
The cheat sheet you'll find in this article summarises the most common and reliable chart patterns Nigerian traders should know. It includes visual illustrations, how to identify each pattern fast, and what the likely outcomes are.
Remember, no pattern guarantees profit but combining chart patterns with other indicators and Nigerian market context often improves trade accuracy.
In markets affected by local factors like naira volatility, fuel scarcity impacting power supply, or government policy changes, being quick to spot these patterns offers an edge. This guide will help you interpret chart patterns sensibly and apply them to your trading strategy.
Next, we will explore key reversal patterns then continuation patterns, so you can recognise them confidently and start applying them right away.
Chart patterns form a vital part of technical analysis and offer traders a snapshot of market psychology. They reveal how buyers and sellers interact over time, reflecting sentiment shifts and potential price movements. For Nigerian traders active in the stock or forex markets, recognising these patterns can improve timing decisions, helping to enter or exit trades at more favourable points.
At their core, chart patterns are visual shapes formed by price action on a trading chart. They represent repetitive behaviours that traders expect to follow certain outcomes based on historical precedent. For example, a "head and shoulders" pattern often signals a likely reversal from a bullish trend to bearish, while an "ascending triangle" suggests continuation of an uptrend. These formations condense complex market data into clear signals, enabling quicker interpretation without overreliance on numbers alone.
Nigerian markets are known for their volatility and sometimes unpredictable swings. Chart patterns help bring structure to this chaos by signalling potential shifts before they become obvious. Using them alongside other tools like volume analysis or moving averages strengthens trading strategies. For instance, a trader observing a double bottom pattern on a popular NGX-listed stock such as Dangote Cement can anticipate a possible trend reversal and plan buys accordingly. This practical edge matters especially during seasonal volatility in the ember months or ahead of political events.
A printable chart patterns cheat sheet compiles essential patterns with quick descriptions and key trading signals. To get the most from it, keep the cheat sheet visible during trading sessions and consistently match live charts against the reference. Start by identifying the broader trend, then check if any patterns fit ongoing price movements. Over time, this strengthens pattern recognition and decision-making speed. Also, update the cheat sheet with local market examples or personal notes, tailoring it to specific instruments you frequently trade.
Using chart patterns wisely provides Nigerian traders a reliable approach to navigating volatile markets, reducing guesswork and improving confidence.
Integrating chart patterns into your trading toolkit, especially with a handy printed guide, can markedly improve your market reading skills and trading results.
Reversal patterns signal potential turning points in price trends, making them vital tools for Nigerian traders looking to enter or exit positions at the right time. Recognising these patterns early can help avoid costly mistakes, particularly in volatile markets like the Nigerian Stock Exchange or the Forex market, where price swings can be quite sharp. Traders rely on reversal patterns to anticipate a shift from an uptrend to a downtrend or vice versa, which improves timing and strategy.
The head and shoulders pattern is easy to spot once you know what to look for. It consists of three peaks: a higher peak in the middle known as the "head" and two lower peaks on either side called the "shoulders." The line connecting the lows of these peaks is the "neckline." This pattern typically forms after an uptrend and serves as a warning that the price may soon reverse. For example, if you see this shape on the chart of a popular NGX-listed stock like MTN Nigeria, it could indicate the rally is losing steam.
When prices break below the neckline after the formation of the right shoulder, it signals a potential trend reversal from bullish to bearish. Traders often interpret this as a cue to sell or short the asset to avoid losses or profit from the downward move. It is particularly useful in the Nigerian market where sudden economic news can trigger reversals.
Like most patterns, the head and shoulders is not foolproof. Sometimes the price breaks the neckline but quickly reverses again, leading to false signals called "whipsaws." Also, the pattern relies on confirmation through volume and other indicators, which might not always be robust in low-liquidity Nigerian stocks.
A double top consists of two distinct peaks at roughly the same price level, separated by a decline, while a double bottom shows two roughly equal troughs with a peak in between. These patterns reflect strong resistance or support levels. For instance, if the Nigerian Naira/USD pair forms a double top around ₦460 to $1, it signals selling pressure at that level.
Double tops often lead to a reversal from an uptrend to a downtrend, as sellers overpower buyers at resistance. Conversely, double bottoms suggest buyers are defending a support level, potentially pushing prices higher. These patterns serve as visual red flags for traders to anticipate market shifts.
Confirm the pattern with volume: volume usually decreases as the second top or bottom forms, then spikes during the breakout. Nigerian traders can place stop losses slightly above or below the pattern to manage risks. Waiting for a clear breakout beyond the support or resistance level reduces false entry signals.
Similar to double tops and bottoms, triple tops and bottoms have three peaks or troughs at the same price level. This stronger test of resistance or support suggests a more significant reversal might follow. Spotting these on charts in slower-moving Nigerian stocks can signal critical moments for long-term positions.
A triple top signals pronounced selling pressure and often marks the end of an uptrend, with a likely shift to bearish sentiment. On the other hand, triple bottoms demonstrate strong buying interest and suggest the price may rise afterward. Recognising these can help traders and investors adjust their strategies in time, especially amid shifting market fundamentals or policy changes affecting sectors like banking or oil.
Identifying reversal patterns like head and shoulders or double and triple tops and bottoms sharpens market timing. These tools help Nigerian traders navigate uncertainties, reduce losses, and maximise gains across stocks and forex.
In practice, combining this knowledge with volume and broader market context provides a fuller picture and enhances decision-making.
Continuation patterns signal that the current market trend is likely to persist after a brief pause or consolidation. For Nigerian markets, especially the NSE and forex trading involving the naira and major currencies, recognising these patterns can help traders maintain positions and avoid premature exits. These patterns often indicate healthy market confidence, even during temporary slowdowns.
Triangles form when price action converges between two trendlines drawn from recent highs and lows. An ascending triangle has a flat upper resistance and rising lower support, suggesting increasing buying pressure. The descending triangle flips this setup, with a flat lower support and declining upper resistance, often signalling selling pressure. Symmetrical triangles appear with both trendlines sloping towards a point, indicating market indecision.
In Nigerian stocks like Dangote Cement or MTN Nigeria, spotting these triangle formations during sideways movement can highlight potential continuation signals aligned with broader economic factors like CBN policies or telecom growth.
After triangle formation, a breakout usually follows. In an ascending triangle, traders expect a bullish breakout, continuing the uptrend. Descending triangles tend to resolve with bearish breakouts, while symmetrical triangles can break either way. Observing volume spikes alongside breakouts increases confidence in the move.
For forex pairs involving the naira, such as USD/NGN, these triangles help traders anticipate continued currency strengthening or weakening rather than sudden reversals.
Flags and pennants appear as brief consolidation zones after sharp price movements, resembling small rectangles (flags) or small symmetrical triangles (pennants). Their short duration and parallel or converging trendlines reflect a brief pause before momentum resumes.
These patterns often form after explosive moves in heavily traded Nigerian stocks or during sharp naira fluctuations in the forex market, signalling a potential quick continuation.
Volume often declines during flag and pennant formations, signalling temporary indecision. Traders watch for volume surges on breakout to confirm the pattern’s validity.
In Nigerian trading sessions, where market liquidity may ebb during specific times or ember months, volume analysis alongside these patterns becomes even more critical.
Entering a trade upon breakout from the flag or pennant is common. Confirmation comes with a close above resistance (in bullish flags) or below support (in bearish). Setting stop losses just outside the opposite boundary helps manage risks.
For traders in Nigeria, this approach fits well with volatile sessions where quick confirmation is vital.
Rectangles are formed when price bounces between parallel support and resistance levels, showing clear sideways movement. Channels add a directional tilt, either upward or downward, forming a price corridor.
In Nigerian markets, stocks like Guaranty Trust Bank often trade within channels during consolidations, giving traders visual cues about strength and direction.
A breakout beyond these zones signals renewed momentum in the direction of the breakout. Confirming this with follow-up price action and higher volume strengthens the trade validity.
Traders watching NSE charts benefit by combining these patterns with market news or macroeconomic data releases for better timing.
Continuation patterns provide essential clues for Nigerian traders eager to ride prevailing trends. Understanding triangle shapes, flag formations, and channel behaviours equips traders to act decisively and manage risk effectively in the dynamic Nigerian market environment.
Creating a printable chart patterns cheat sheet is more than just putting pictures on a page. It’s about building a quick-reference tool that traders in Nigeria can rely on during fast market moves. The cheat sheet should highlight essential patterns clearly, so you don’t waste time trying to recall details while trading. When designed properly, it becomes a dependable companion that sharpens your market timing and decision-making.
Visual clarity is key in making the cheat sheet effective. Use simple, colour-coded diagrams that capture the key shape of each pattern, like a head and shoulders or double top. Avoid overcomplicating with too many lines or indicators. For instance, use distinct colours to mark breakout points or trendlines. This makes it easier to recognise patterns quickly on your trading screen, especially when markets move fast.
Alongside visuals, include concise bullet points summarising what to look for in each pattern: how to identify it, what it signals, and common pitfalls. Keep these summaries focused on practical tips relevant to Nigerian markets. For example, for a double bottom, note typical price targets based on the Nigerian Stock Exchange’s volatility levels or forex swings. Summaries should be brief but packed with info to help you decide fast.
Incorporating examples from the Nigerian Stock Exchange (NSE) grounds your cheat sheet in real market context. Patterns identified in popular equities like Dangote Cement or MTN Nigeria give you a stronger sense of how these shapes behave locally. For example, show how an ascending triangle played out on MTN’s chart in recent months to illustrate breakout strength.
Chart patterns behave slightly differently in forex markets due to higher liquidity and volatility. Including examples from the popular USD/NGN pair or EUR/NGN offers traders insights into typical movements in Nigeria’s forex sector. This helps you apply pattern analysis beyond stocks, especially given the active retail forex trading scene locally.
Print your cheat sheet and keep it within easy reach while trading, whether it’s at your desk or on a tablet. Having it ready avoids fumbling through textbooks or extensive notes during critical moments. Even a laminated copy can be useful during busy periods like ember months when market action intensifies.
Markets evolve, and so should your cheat sheet. Regularly update it with new patterns you observe or tweaks that reflect Nigeria’s changing market conditions. For example, if a new pattern emerges frequently on NSE due to regulatory changes or macroeconomic shifts, add it to stay relevant. Review your cheat sheet quarterly or after key market events.
A cheat sheet is only as useful as it is relevant and accessible during trading. Keep it simple, localised, and updated to stay ahead.
Mastering chart patterns alone won't guarantee profitable trades. It’s crucial to combine them with other tools and disciplined risk management to navigate Nigeria's volatile markets effectively. This section offers practical guidance to help Nigerian traders make better-informed decisions.
Moving Averages help smooth out price data over a specific period, revealing overall trends. For instance, using the 50-day and 200-day moving averages together can confirm trend direction. When a shorter moving average crosses above a longer one, it might reinforce a bullish chart pattern like a cup and handle on Nigerian equities such as Dangote Cement. Conversely, a cross below could suggest a downtrend, signalling caution.
Volume Analysis reveals the strength behind price movements. A breakout from a chart pattern accompanied by high volume is more reliable. For example, when a stock listed on the Nigerian Exchange (NGX) breaks through a resistance line in a triangle pattern with increased trade volume, it indicates strong buyer interest. Low volume on a breakout often means the move may fail, leading to a false signal.
Relative Strength Index (RSI) measures market momentum and helps identify overbought or oversold conditions. If a bullish pattern forms while RSI is below 30 (oversold), the chances of a strong upward move increase. For forex traders dealing with pairs like USD/NGN, RSI combined with reversal patterns like double bottoms can guide entry points more accurately.
Stop Loss Placement is vital to protect capital. Traders should place stop loss orders just beyond key support or resistance levels inherent in the chart pattern. For example, if trading a head and shoulders pattern in NGX stocks, the stop loss could be set slightly above the right shoulder to limit losses if the expected reversal fails.
Setting Targets involves estimating potential profit points based on pattern size and price projections. If a double top pattern signals a reversal, the expected price drop could correspond to the height between the peaks. Setting realistic targets helps in locking profits and avoiding greed-driven decisions often leading to losses in Nigeria’s sometimes unpredictable markets.
False Breakouts occur when price moves beyond a pattern boundary but then reverses quickly. Many Nigerian traders fall for these traps, especially during periods of market illiquidity, such as ember months. One way to avoid this is by waiting for confirmation—like a close above resistance for multiple trading sessions or accompanying volume spike—before entering a trade.
Ignoring Market Context means overlooking broader economic or political factors affecting Nigerian markets. Chart patterns do not occur in isolation. For example, during fuel subsidy protests or central bank policy shifts, technical signals may fail as markets react to news rather than price action alone. Always complement chart analysis with current affairs awareness to improve trade timing.
Combining chart patterns with other tools and sound risk management improves your trading edge. Avoid rushing trades without confirming signals, especially in Nigeria’s dynamic markets.
This practical approach will empower you to trade smarter and reduce costly mistakes.
🔍 Learn to spot key crypto chart patterns for smarter trading in Nigeria. Discover how to predict price moves & avoid losses, boosting your ₦ trading game today!

📈 Master 7 vital chart patterns every trader should know to spot market moves, trade smart, and manage risks well. Practical tips included for Nigerian traders!

📈 Continuation chart patterns show traders clear signals to spot when a market trend will resume after a pause, helping make smart trades in Nigeria and beyond.

📈 Learn key forex chart patterns and boost your trading skills with easy-to-use PDF guides. Perfect for Nigerian traders aiming to predict market moves accurately.
Based on 5 reviews